












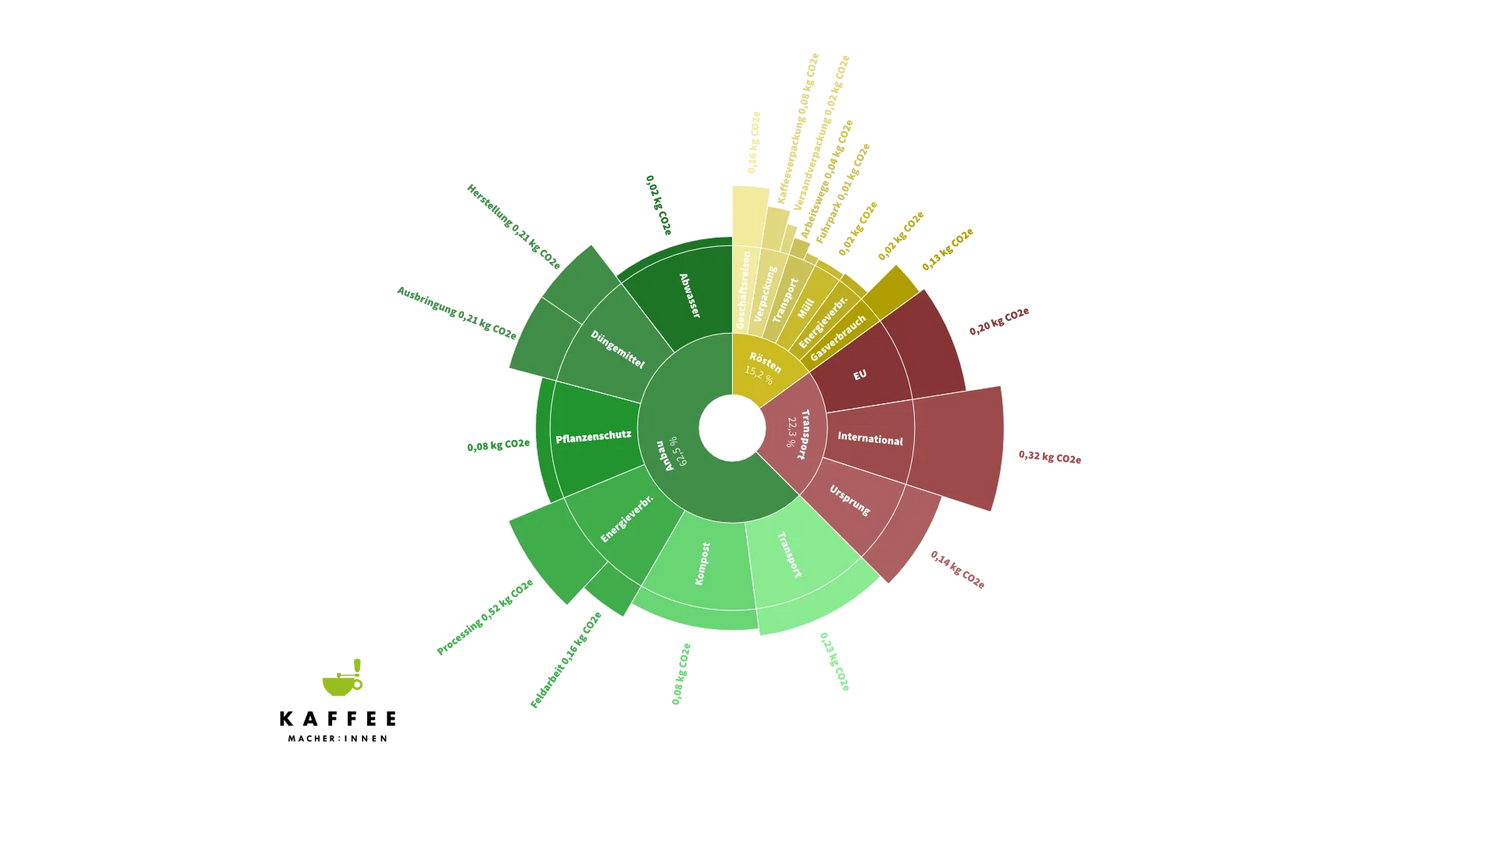
Environmental impact analysis using the example of Finca Santa Rita in Nicaragua with the help of the Cool Farm Tool.
Download study: Environmental impact of coffee cultivation Coffee Makers
Note
In this article/study, we calculate the carbon footprint of coffee using our coffee farm Santa Rita as an example, from cultivation to roasting. Santa Rita is located in the Dipilto region in northern Nicaragua and is a small farm of 4.16 hectares. The figures are based on the 2021/22 harvest and represent only a snapshot due to the relatively low yield. At the time of data collection, the farm was undergoing major renovation and the harvest yield was low, resulting in a high carbon footprint per kilogram. However, the study also presents a framework for calculating the footprint of other coffee farms along the coffee chain.
The study summarizes essential aspects of our work in the research and work area of sustainability at the Coffee Makers. This area is headed by environmental engineer Tobias Milz.
Abstract
The CO₂ balance for the 2021/2022 harvest was determined using the Cool Farm Tool. This is a 4.16-hectare farm in Dipilto, Nicaragua, operated by the Coffee Makers in partnership with Bridazul. The calculation is based on a yield of 268.26 kilograms of export-quality green coffee. The coffee farm was taken over by Coffee Makers GmbH in 2017 and has been undergoing renovation since then. During the period under review, less than half of the plants were in production (3,665 in production; 5,363 not in production). Fertilizers and plant protection products were applied to the entire farm, not just on the productive areas. We therefore expect a reduced footprint per kilogram in the coming years. This will be achieved both through improvements in practice and through increased yield as more trees come into production.
The practice on Santa Rita is that no further processing steps are carried out on the farm beyond harvesting and initial cleaning of the coffee cherries. The harvested cherries are transported to the partner farm "El Arbol", which is 7.4 kilometers away, where they are further processed. The next steps then take place at Bridazul's Dry Mill in Dipilto, which is a further 23.3 kilometers away. The green coffee is shipped together with other coffees from the Dipilto region and reaches our roastery in Basel, where it is roasted and packaged.
The export-ready green coffee has a carbon footprint of 1.57 kilograms of CO₂ equivalent per kilogram, which corresponds to 101.15 kilograms of CO₂ equivalent per hectare and a total of 430.79 kilograms of CO₂ equivalent for the entire harvest.
We have deliberately decided not to include the existing trees and unused areas of the farm as a carbon sink in the calculation. We cannot guarantee that the trees will remain standing for the next 50 to 100 years in the event of forest fires or sale of the farm. If we were to include these, the farm could be credited with approximately 1,000 kg of CO₂.

Distribution of emissions from Santa Rita roasted coffee
In total, our calculation of transport and the footprint of the Coffee Makers roastery in Basel in 2022 results in a CO₂ equivalent of 2.96 kilograms of CO₂ equivalent per kilogram of roasted coffee, assuming a roasting loss of 15%. The distribution of this footprint is as follows: The largest share, approximately 1.85 kilograms of CO₂ equivalent per kilogram, is attributable to the roasted coffee, which accounts for about 62.5%. The transport share is 22.5%, which corresponds to 0.66 kilograms of CO₂ equivalent per kilogram of roasted coffee. The roastery causes a further 0.45 kilograms of CO₂ equivalent per kilogram, which accounts for about 15%. The share of coffee from our own farm processed at the roastery is approximately 2%
Introduction
The study is an environmental impact assessment of the Santa Rita farm of the Coffee Makers. It was created with the help of the Cool Farm Tool.
Farm
The farm is Santa Rita with the associated area Mil Varidades, which has been owned by Coffee Makers GmbH since 2017. The farm is located in northern Nicaragua, in the department of Nueva Segovia in the municipality of Dipilto. The farm covers 4.16 hectares and at the time of data collection had 9,028 coffee plants, of which 3,665 were in production. The farm has been undergoing renovation since it was taken over by Coffee Makers GmbH. Many plants were removed, new varieties were planted. As a rule, plants bear their first cherries after three years. This explains why only a portion of the plants bear fruit.
The cultivation method is agroforestry cultivation with manual harvesting. So far, plant protection has had to be used to protect against Broca infestation or Roya, and synthetic fertilizers and plant protection products have been used to promote plant growth. The goal is to gradually eliminate these. They are to be replaced by "biologicals" and self-produced compost. In the next step, Bridazul and the Coffee Makers are working to centrally and efficiently produce high-quality compost from coffee production by-products.
The farm is located 7.4 km away from El Arbol, another farm operated by Bridazul. Bridazul are the Coffee Makers' partners who operate the farm on site. Apart from an initial selection of the cherries, all essential post-harvest processes take place not on Finca Santa Rita, but on El Arbol.
For further fermentation and drying of the cherries, the coffee is transported to Ocotal to Bridazul's Dry Mill, which is 23.3 km away. This is also where the offices and laboratory are located. Before the coffee is exported, it is hulled at Edman Café in the same town and packaged in 30 kg jute sacks with liners.


Boundaries of the analysis
As a rule, environmental impact assessments only consider work on the farm. Since the farm would not function without partners, work outside the farm must also be included. Therefore, various factors such as energy consumption in the office and during processing must be allocated proportionally to the coffees from the farm.
The Cool Farm Tool does not account for waste or packaging materials. This means that jute bags, liners and other packaging used either for the coffee or in its production are not considered.
The different resource situations in different countries are also not factored into the calculation. Therefore, the calculation of energy consumption is based solely on a global average with regard to electricity use.
Uncertainties in the data
A major criticism of Environmental Impact Analysis (EIAs) is that uncertainties often receive little or no attention in communication<1>. However, every environmental analysis must deal with uncertainties and assumptions. Therefore, it is very important to identify these. The following are the uncertainties evaluated and contextualized by category.
We have evaluated the uncertainties according to the German school grading system. From 1 very low uncertainty to 6 no certainty.
| Area | Rating | Comment |
| Fertilizer |
2 |
We know the exact quantities and types of fertilizers used The uncertainties lie in the composition information we found online and in the calculation. In our case, we included all fertilizers, including applications to plants that are not yet producing. |
| Plant protection |
3 |
We know the exact quantities and types of plant protection products used The uncertainties lie in the composition information we found online and in the calculation. In our case, we included all fertilizers, including applications to plants that are not yet producing. |
| Harvest |
1 | We know the exact amount of green coffee and roasted coffee. |
| Waste management | 2 |
Relatively accurate estimate of the mass of Casulla. Casulla as what remains from the first grinding. It contains more pulp than the Cascara. Cascara is the husk that remains after depulping. |
| Transport |
1 | Distances and work effort, as well as vehicles are known |
| Energy requirement |
2 | Based on the invoices, it can be clearly seen how the consumption is structured. Uncertainty regarding distribution and electricity mix |
| Soil properties |
4 | The soil studies are no longer quite up to date (2019) |
| Processing |
2 | Good basis. However, the allocation is an average value for all Santa Rita coffees. |
| Wastewater |
3 | Expert estimate |
Data collection
Most of the data was collected on site in April 2022. Using a questionnaire specifically developed for coffee farms and containing over 200 questions, all ecological, economic and social factors were collected. Additional details for the calculation were provided by Bridazul. Bridazul bills the Coffee Makers for all work carried out on Santa Rita, including materials used. This allows for very accurate tracking of what, how much and when was used.
Furthermore, the Coffee Makers are the only buyers of coffee from the farm, so it can be precisely stated which processing was applied to which coffee. However, for the calculation, an average must be assumed, which affects water and energy consumption.
Results
The calculation shows that the total footprint of the 21/22 harvest is 420.78 kg CO₂ equivalents. This corresponds to 101.15 kg CO2e per hectare and 1.57 kg CO2e per kilogram of green coffee.
| CO2 | N20 | CH4 | CO2e | CO2e per ha | CO2e per kg | |
|
Wastewater |
0 | 0 | 0.22 | 6.03 | 1.45 | 0.02 |
|
Waste management |
0 | 0.04 | 0.37 | 20.71 | 4.98 | 0.08 |
| Fertilizer production |
57.03 | 0 | 0 | 57.03 | 13.71 | 0.21 |
| Soil / Fertilizer |
0 | 0.21 | 0 | 57.12 | 13.73 | 0.21 |
|
Plant protection |
36.30 | 0 | 0 | 36.30 | 8.73 | 0.14 |
|
Energy consumed (Processing) |
139.50 | 0 | 0 | 139.50 | 33.53 | 0.52 |
|
Energy consumption (Field) |
41.80 | 0 | 0 | 41.80 | 10.05 | 0.16 |
|
Transport outside the business |
62.29 | 0 | 0 | 62.29 | 14.97 | 0.23 |
|
TOTAL |
420.78 | 101.15 | 1.57 |

Energy use (Electricity)
At 33.2%, energy emissions for processing are the largest factor. This is due to the fact that these are heavily processed coffees.
The coffees undergo a controlled fermentation process at Bridazul, which also provides a cooling facility to ensure a controlled environment. This results in high energy expenditure, even though the process only runs for one month per year. If we assume electricity costs of $0.05 per pound of green coffee, this corresponds to a consumption of 126.56 kWh for our coffees.
Fertilizer
On many farms where plants are exposed to full sun, fertilizers make up a large part of the emissions (> 80%). This becomes clear when looking at the source of the assumptions in the studies used, such as for Ecoinvent. Ecoinvent is a widely used environmental database. However, Ecoinvent does not have a dataset for coffee from Nicaragua, but does have one for Honduras. Due to the farm's geographic proximity, this dataset can be used. Here, the application of NPK fertilizers is assumed at 343-223-221 kg/ha, resulting in emissions of 10.11 kg CO2e / kg green coffee.
On Santa Rita, NPK fertilizer is applied at 6.56-5.80-26.67. Biological fertilizers are included here as well as fertilizers for plants that are growing and not yet producing.
The high fertilizer application in the Honduras dataset achieves a yield of 1,340 kg / ha. The yield at Santa Rita is comparatively 101.15 kg/ha. Thus the yield is 13.25 times higher. However, the factor for fertilizer application of nitrogen (N) is increased by a factor of 52.29, phosphorus by a factor of 38.45, while potassium is lower than the yield factor (8.29). However, it is expected that yield will increase in the coming years as more plants enter the production phase. (As a rule, coffee plants begin bearing cherries after three to four years.)
Transport
Transport is a major factor at 14.8%. This is mainly because workers and all equipment must be transported to the farm, as only two employees live on the farm. However, transport does not include transporting the coffee to the port. We calculate this separately together with shipping and transport in the EU.
Roads in remote regions of Nicaragua cannot be compared to roads in Switzerland, and the additional effort caused by unevenness or lack of paving must be taken into account.
Discussion
Comparison of emission data for green coffees
Existing environmental data for coffee vary widely or are not available. Data in environmental databases such as Ecoinvent are designed to cover a high level of universality. Therefore, the focus is on producing countries such as Brazil, Vietnam, Colombia, Indonesia and Honduras, which account for 85% of global supply. The remaining 15% are distributed among another 55 producing countries and therefore receive less attention in large-scale studies.<2>
Ecoinvent therefore does not have data for Nicaragua. Since Honduras is Nicaragua's neighbor and practices similar agriculture and coffee cultivation in Honduras is similar to cultivation structures in Nicaragua, a comparison is appropriate. The Honduras dataset shows 10.11 kg CO2e / kg green coffee<3>. The dataset from Carbon Cloud, a freely accessible database focused on food, shows 4.0 kg CO2e/kg green coffee<4> for coffee from Nicaragua. A study by Caravela Coffee, which also considers carbon storage through the agroforestry system, lands at approximately -12.7 kg CO2e/kg green coffee<5>. The farm under consideration is thus in the middle of these values. If land-use change were to be considered on Santa Rita, approximately 4 kg CO2e/kg green coffee would have been stored on Santa Rita. This would only consider the area no longer managed as forest. In addition, there would be new trees and shrubs such as bananas and Inga.

Comparison of emission data for roasted coffees
Looking at roasted coffees includes cultivation, transport and roasting (Roasting in our calculation also includes packaging). To find reliable data for roasted coffee requires a very careful examination of the studies and the database they are based on. A frequently cited study <6> "Life cycle assessment synthesis of the carbon footprint of Arabica coffee: Case study of Brazil and Vietnam conventional and sustainable coffee production and export to the United Kingdom" shows a footprint for conventional coffee from Brazil for consumption in the UK of 14.61 kg CO2e / kg roasted coffee. However, the coffee in this study is flown. Which is extremely rare.
Ecoinvent does not provide data. Carbon Cloud provides various data, but these are mainly based on coffee from Brazil. Thus the data is very similar.

Roasted coffee from Santa Rita
To calculate a footprint for the coffees from the farm, we used two additional tools that we developed ourselves as a company. A calculator for roastery footprints based on data from Ecoinvent and a transport calculator based on data from Mobitool (as of 2023).

The footprint for 2022 of the Coffee Makers roastery has already been published. The roastery's emissions for 2022 amount to 22.122 t CO2e, which corresponds to 0.45 kg CO2e /kg roasted coffee.

In 2022, the Coffee Makers purchased 4,780 kg of coffee from Nicaragua. This also includes Santa Rita coffee. The emissions from transport amount to 2,692.19 kg CO2e, with the proportional share for Santa Rita coffee at approximately 150 kg CO2e and thus at 0.56 kg CO2e /kg green coffee.
For both the emissions from the farm and the emissions from transport, 15% roasting loss must also be accounted for. This results in a carbon footprint of 2.96 kg CO2e / kg roasted coffee per kilogram.
| Green coffee | Roasted coffee | Distribution | |
| Cultivation | 1.57 | 1.85 | 62.50 % |
| Transport | 0.56 | 0.66 | 22.30 % |
| Roastery | 0.45 | 15.20 % | |
| Total | 2.51 | 2.96 | 100 % |
What's missing?
The coffee chain continues because coffee is drunk at home after roasting and consumed by us in restaurants. Some 250-gram bags are sent around the world by post, and then brewed as filter or espresso? What impact does that have? What effect does a thermoblock or a 2.5-liter boiler have on electricity consumption and footprint?
We looked into these questions. You will find the first draft, current status on our sustainability page.
Is a link missing or are you interested in our work in this area? Then sign up for our newsletter to stay up to date on further topics in this area.
In the meantime, the 22/23 harvest at Santa Rita has been completed and the 23/24 harvest is currently being carried out. So we will soon be able to supplement the study data with additional years.
If you have questions or find logical errors, please comment or write to us. Thank you in advance!
Sources
<1> https://www.tandfonline.com/doi/abs/10.3152/147154606781765345, Status: 20.12.23
<2> https://coffeebarometer.org/explore-coffee-barometer/, Status: 20.12.23
<3> https://v38.ecoquery.ecoinvent.org/Details/PDF/90C86EF0-3AFE-4D85-8885-779EBE69FAD4/290C1F85-4CC4-4FA1-B0C8-2CB7F4276DCE, Status: 20.12.23
<4> https://apps.carboncloud.com/climatehub/product-reports/id/74726502789, Status: 21.12.23
<5> https://caravela.coffee/project/producing-greener-coffee-at-farm-level/#whitepaper, Status: 20.12.23
<6> https://rgs-ibg.onlinelibrary.wiley.com/doi/full/10.1002/geo2.96, Status: 22.12.23