














You love coffee and strive for the perfect cup? Then you've surely heard about grind size. But how "well" a grinder really grinds depends on much more than just whether the powder is fine or coarse.
This is where particle size distribution (Particle Size Distribution = PSD) comes in – a decisive factor for extraction and thus for the taste of your coffee. Over the past few years, we have intensively tested over 70 coffee grinders and delved deep into the world of particle analysis. In this article, we explain what particle distribution is all about, how we measure it, and which key metrics really matter.
Also Worth Reading: How Slow Feeding affects your grinder's particle distribution!
What is a Particle Size Distribution (PSD)?
When your grinder breaks down coffee beans, it doesn't produce just a single particle size, but an entire spectrum – from very fine "fines" to coarser "boulders". Particle size distribution describes exactly this mixture: How many particles of which size are present in your ground coffee? How this spectrum turns out depends largely on the grinding mechanism, i.e., whether you're grinding with a conical or burr grinder.
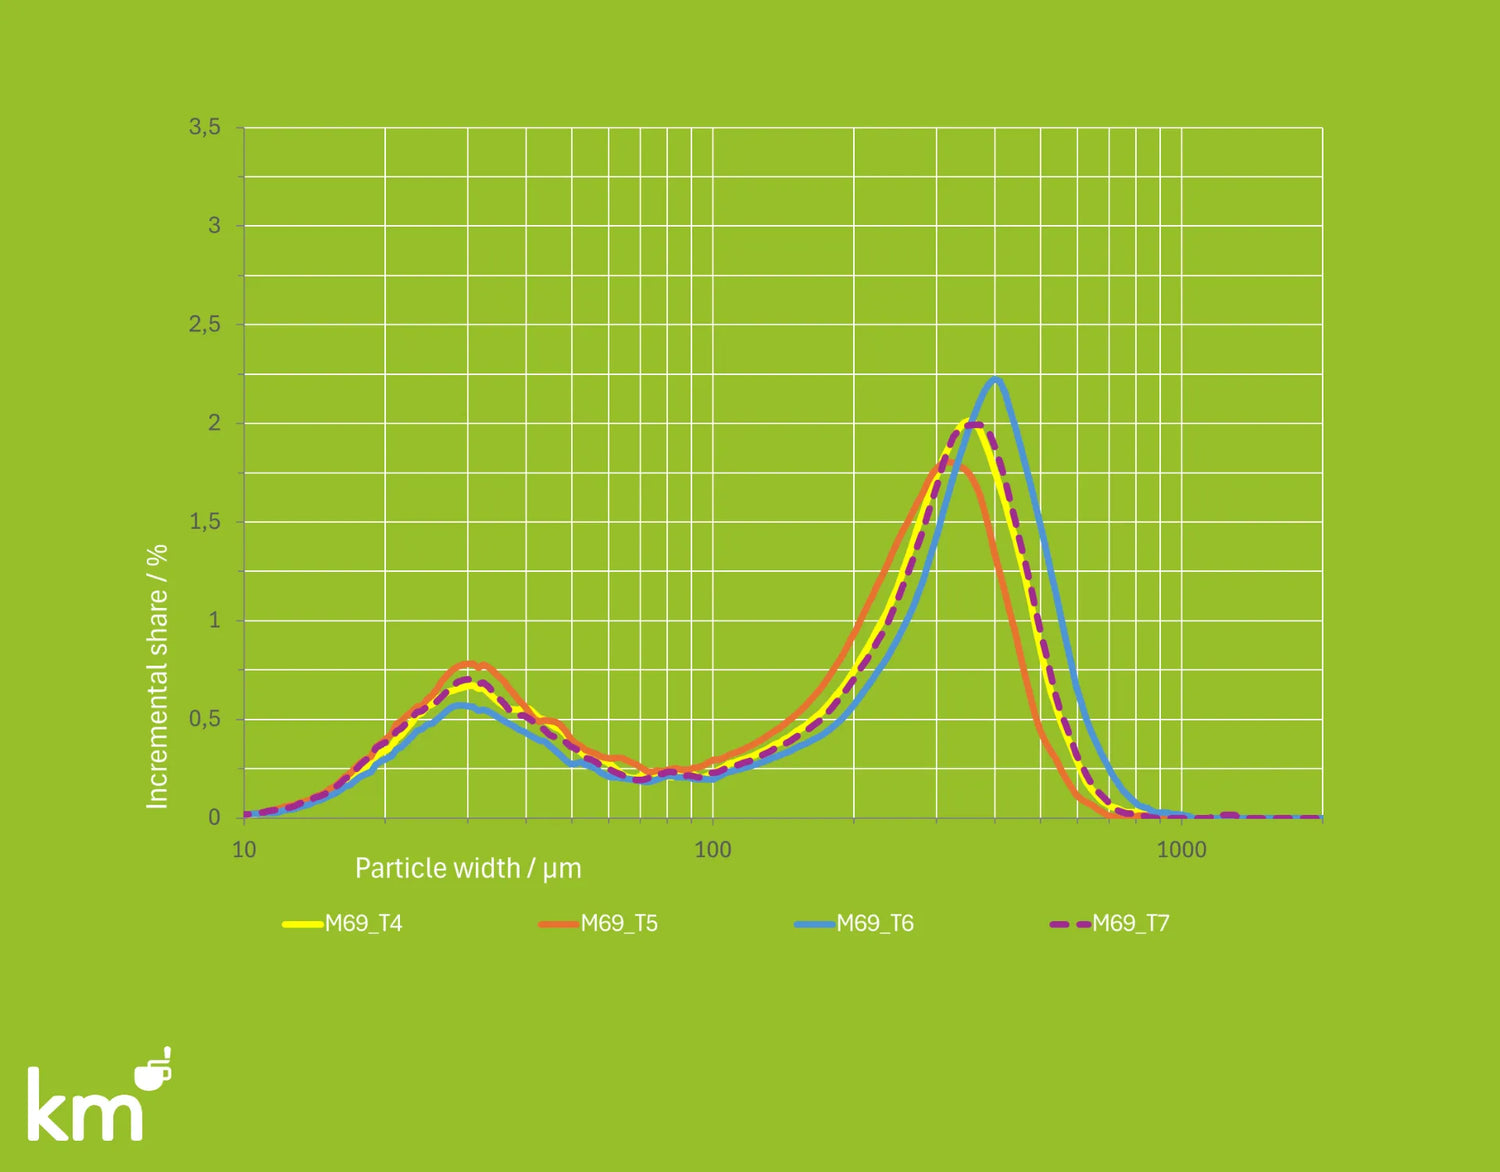
Typically, we see what's called a bimodal distribution in espresso grounds. This means there are usually two "peaks" in the distribution:
- A fine peak (Fines Peak) at very small particle sizes.
- A main peak (Nominal Peak), which makes up the largest portion of the grounds and whose position depends strongly on the set grind size.
This distribution is crucial because it significantly influences how water flows through the coffee during brewing and which flavors are extracted and how quickly. An uneven distribution can lead to uneven extraction – some particles are then over-extracted (bitter), others under-extracted (sour).

How do we measure particle distribution? Our protocol
To obtain objective and comparable data, we work closely with the team of the Coffee Excellence Center at the Zurich University of Teacher Education (ZHAW). Our measurements follow a standardized protocol:
- Measurement device: We use a high-precision device based on dynamic image analysis (a Retsch Camsizer X2, affectionately called "Kevin" internally). The coffee particles are passed through a chute and captured by cameras. Unlike laser diffraction, this allows us to obtain not only size information but theoretically also shape information, although we focus on size here.
- Sampling: A representative sample is essential. Since finer and coarser particles can separate in the container, we use a sample divider. This divides the ground sample mechanically and fairly, so we obtain a small but representative quantity for analysis.
- Standardization: All grinders are tested with the same coffee (a naturally processed Brazilian from the APAS cooperative) and according to defined recipes (T4 = Espresso, T5 = Ristretto, T6 = Lungo, T7 = back to Espresso) to ensure comparability.

The most important metrics in detail
From the measurement data, we derive various metrics. The three most important for evaluating a grinder are:
x50 (Median):
x₅₀ (median particle size): This is the middle particle size in the statistical sense. More precisely: 50% of particles are smaller than x₅₀ and 50% are larger. Therefore, x₅₀ is also called the median or D50. For espresso grinds, it typically lies in the hundreds of micrometers range (e.g., 200–300 µm, depending on grinder and setting). x₅₀ can be considered as a rough measure of the "average grind size" – it shifts to the left (smaller values) when we grind finer, and to the right (larger values) with coarser grinding. For extraction, a small x₅₀ means: lots of surface area, potentially higher extraction (up to over-extraction) and slower flow. A larger x₅₀ results in less surface area, lower extraction (risk of under-extraction) and faster flow. Important: x₅₀ alone doesn't describe the entire distribution, but it's a good starting point for comparing grinds.
🔎 x50 in a nutshell: The x50 value (in micrometers, µm) is the point at which 50% of the volume of ground coffee consists of particles smaller than this value, and 50% consists of particles larger. It represents the "typical" particle size in the ground coffee.
Fine fraction (Qf <100 µm / Fine peak):
By this we mean the fine fraction in the ground coffee – specifically the percentage of particles smaller than 100 µm. Why 100 µm? Because in many grinder analyses, there's a minimum point around this size between the large main peak and the "fine dust hill". Everything to the left of that we call fines. This value (often given as Q_<100µm) tells us how dusty a grind is. Example: 30% <100 µm means that almost a third of the coffee particles are finer than a human hair – that's quite a lot of "coffee dust".
A high fine fraction can increase the body of an espresso (intensity; because more fine particles make it into the cup), but it also carries the risk of over-extraction and bitterness (the fines release flavors very quickly and tend to over-extract). They also clog gaps in the puck and increase resistance: grinders that produce many fines often need to be set much coarser for espresso to get even a halfway flowing shot. Conversely, grinders that produce hardly any fines (so-called unimodal distributions with only one peak) can be set much finer without the shot running dry – because there are fewer clogging particles. The fine peak thus decisively determines how a grind behaves and tastes: from silky and dense (lots of fine dust) to clear and light (little fine dust).
🔎 Fine fraction in a nutshell: This value gives the percentage volume fraction of particles that are smaller than 100 micrometers. These very fine particles are often called "fines" and form the fine peak in the distribution curve. This peak often lies in the range of 30-70 µm.
"Main Peak Width" (60% Coarse Peak Width):
When we speak of the width of the main peak, we mean the size range in which 60% of all coarse particles (i.e., larger than 100 µm) are contained. The fines, i.e., the very fine particles below this threshold, are deliberately excluded. This creates a clear view of what a grinder produces in its "main business": the medium to coarse particles that significantly influence espresso.
Imagine this main area as a mountain landscape without fog: Is the main peak a narrow, clear ridge, where almost all particles are of similar size? Or a broad hill surrounded by small hill chains? That's exactly what the 60% Coarse Peak Width shows – it describes how narrow or broad the grounds are distributed in the main area.
A small value means: The particle sizes lie close together, the grounds are uniform. A large value means: The distribution is spread out – there are both smaller and significantly larger particles around the average. The result: Some of the coffee extracts faster, some slower – this can lead to flavor inconsistency.
Why does this matter? Because a narrow distribution suggests more even extraction – with balanced, clean flavors. If the distribution is broad, medium-sized particles and coarse "boulders" often lie side by side in the puck. The latter give off little flavor – they under-extract, while the rest is already optimal or even over-extracted. The result: Acidity and bitterness stand disconnected next to each other, sweetness is lost.
In our tests with over 70 grinders, it became clear: Once the main cloud becomes wider than about 300 µm, espressos often taste "scattered" – little structure, little harmony. A smaller peak width, on the other hand, is typical of modern grinders with precise burrs and stable alignment. They consistently produce good grounds – the foundation for clear, extraction-stable espresso.
🔎 In short: The 60% Coarse Peak Width doesn't measure the width at 60% of the curve height, but the size range containing 60% of the coarse particle mass. It's an objective measure of the uniformity of the main portion in the grounds – and thus a key indicator of grinder quality.
Understanding particle distribution curves
When we look at the results of particle measurement, we usually see two curves: an incremental and a cumulative distribution. Both show the same ground sample – but from two different perspectives.
Important: The X-axis in both diagrams – i.e., particle size – is logarithmically scaled. This means: The distance between 10 µm and 100 µm looks the same as the distance between 100 µm and 1000 µm – even though the second range encompasses ten times more size difference.
Why is this important? Because it can easily fool our eyes:
- In the incremental curve, the area under 100 µm often looks wider than it actually is – even though there's actually very little space there.
- In the cumulative curve, a steep rise in the 200–300 µm range can suddenly appear much more dramatic because the distance looks optically small, but is substantively large.
In short: The X-axis is not linear, but follows a logarithmic scale – this is necessary to represent both fine and coarse particles clearly in one chart. But: It changes our sense of "area" and "weighting". Anyone reading the curve should keep that in mind.

Example of an incremental distribution.
Incremental Distribution ("Incremental Share")
The incremental distribution (Incremental Share) looks like a small mountain range. It shows how many particles occur in a certain size range. The Y-axis indicates what fraction (in percent) of the total grounds falls within a narrow size interval – for example, between 240 and 250 µm. The higher a point on the curve, the more particles are exactly in this range. You immediately see: Where's the highest "mountain"? How many fines are there? And how spread out is the whole thing? This makes the incremental distribution the visual map of the grind size – it tells us where the majority of particles lie, how pronounced the fine peak is, and how homogeneous or scattered the grounds appear overall.
- The incremental curve shows you what percentage of coffee powder falls on a specific size range (e.g., how much lies between 30-100 µm).
- It visualizes the peaks very clearly – you recognize the fine peak and main peak and see whether the distribution is bimodal. The X-axis (particle size) is often shown logarithmically here to make the fine range more visible.
- If at 250 µm (X-axis) there's a value of 2% on the Y-axis, this means: → Approximately 2% of all measured coffee consists of particles that are roughly 250 µm in size (more precisely: in the measurement interval around 250 µm).

Example of a cumulative distribution
Cumulative Distribution ("Cumulative Share")
The cumulative distribution (Cumulative Share) tells the same story – but in a different way. Here, the Y-axis shows what percentage of the coffee has been reached when we sum up all particles up to a certain size. The curve starts on the left at zero and then rises steadily – until it reaches 100% on the right. The changes in slope are particularly interesting: A steep section means that many particles are present in this size range – things are really happening with the coffee there. A flat section means: Not much is happening here, only a few particles move in this size range. You could say: The cumulative curve shows how quickly the bag of coffee fills up as we fill it from fine to coarse with particles.
- This curve shows the total fraction (in percent) of all particles that are smaller than or equal to a certain size.
- It always rises from 0% to 100%.
- From this curve you can easily read the x50 value (where the curve crosses the 50% line) and also the fine fraction (the Y value at 100 µm on the X-axis).
Why these values influence taste
Now it gets interesting: How do these distribution properties show up in the cup? Here, both empirical experience and scientific findings come into play. On the one hand, experienced tasters quickly notice when an espresso tastes, for example, over-extracted-bitter due to too many fines, or stays watery and sour due to too coarse particles. On the other hand, analyses – such as by astrophysicist and coffee researcher Jonathan Gagné – have clearly shown that when dialing in an espresso, we're basically setting the fine fraction. In an evaluation of 24 espresso grinders from our test series, Gagné found that different grinders at optimal settings produce surprisingly similar amounts of fines – regardless of average particle diameter. In other words: Baristas turn the grind size primarily until the total amount of fines is right to achieve the desired flow and pressure.
A "fines-loving" grinder thus needs to be set much coarser (so not too many fines clog the puck), while a "fines-averse" grinder can be set very fine (to build up enough resistance in the puck at all). This interplay explains why, for example, unimodal grinders (with few fines) often require very fine shots, which then deliver exceptionally clear flavor notes – this is often called "low-fines shots," which emphasize brighter acidity and floral notes. Conversely, grinders with intentionally more fines often deliver more powerful, full-bodied espressos with thicker texture – classically Italian with more bitter-chocolate character, but sometimes also rough in acidity. The width of the main peak also reflects in the taste. We repeatedly noticed in our tests that very broad distributions (high main peak width) lead to complicated flavor combinations: a certain restlessness in the cup, you could say, which we also describe as "scattered". Part of the extraction goes too far (bitterness, sometimes a metallic note), another part lags behind (sharp acidity), and it's hard to achieve a balanced overall taste.
When particle sizes become more homogeneous (narrower peak), however, the flavor usually comes together more harmoniously – sweetness, acidity and bitterness are in harmony, nothing stands out unpleasantly. This doesn't mean that every grinder with many fines or a broad distribution automatically makes bad coffee. Taste judgments depend on many factors (bean variety, roast, recipe, etc.), and you can balance a lot with technique. Nevertheless: The trends are clear. Grinders that grind very uniformly are appreciated by many coffee enthusiasts for their clean, balanced shots. Grinders that produce more fines often result in powerful, dense shots, but are harder to perfect. Personal taste also plays a role here: Some like the chocolatey punch of a slightly "dirty" espresso, others love the transparent nuance of a "clean" espresso – both can be excellent in their own way. However, particle distribution gives us the scientific tools to make such grinder characteristics tangible and work with them deliberately.
Of course, these three values are also related: Grinders that produce many fines (high fine fraction) often create a slightly broader distribution and a larger x₅₀, because they need to be set coarser. Conversely, grinders with few fines often have a smaller x₅₀ (need to be set finer) and a narrower main peak. Still, it's worthwhile to look at each metric individually to understand the bigger picture.
Conclusion: What we can learn from particle analysis for the perfect coffee
Exploring particle distributions impressively shows that in the seemingly simple act of grinding coffee, there's a hidden world of science. For us coffee lovers, this means: We can approach the subject more consciously. When we understand that a grinder doesn't just grind "fine" or "coarse", but creates an individual fingerprint of fines, average particles, and maybe a few boulders, we can better tailor our coffee recipes to it – or make the grinder choice that suits our preferences.
Different grinding burrs of the same size with different geometries, such as cut, pre-breaker, and tightness of cutting edges, also change particle distribution very significantly.
The insights from particle analysis inspire us to perhaps look (or taste) a bit more carefully at the next espresso: Do I taste hints that my grinder produces many fines? Is the espresso silky, heavy, perhaps with a certain dryness in the aftertaste and less clarity in the flavors? That could be an indication of a high fine fraction.
Or is it crystal clear in its complexity and the individual notes of the coffee stand out – but the body is somewhat less pronounced and perhaps juicy and not heavy and dense? That might be a sign of very homogeneous, fines-poor grinding.
Ultimately, particle distribution shows us how closely craftsmanship and science are intertwined in coffee. The best results emerge when we use both: the curiosity and experimental spirit of the home barista and the knowledge from research. Our journey through the world of coffee particles has shown that behind every aromatic cup is a lot of physics and statistics – but don't worry: You don't need to be an astrophysicist to benefit from it (even if people like Jonathan Gagné certainly help!).
Even a basic understanding of what happens in coffee grounds can help us make more conscious decisions. Whether it's investing in a particular grinder or fine-tuning our recipe – scientific measurements like particle analysis give us an objective foundation to better understand the myth and magic of espresso.
In the end, it's about the taste in the cup. Particle distribution is not an end in itself, but a key that helps us decipher and control taste. So when we next talk about "coarse" or "fine", let's remember: There's much more to it – an entire particle world waiting to be discovered. Have fun continuing to explore and on your way to the perfect coffee!