













The tamping pressure during tamping has a minor influence on espresso extraction. We wanted to scientifically verify this finding from daily practice. For this purpose, we worked with the support of a food technologist and extracted, measured, and varied the tamping pressure on 150 espressos. In this article, we present the results to you.
What is Tamping?
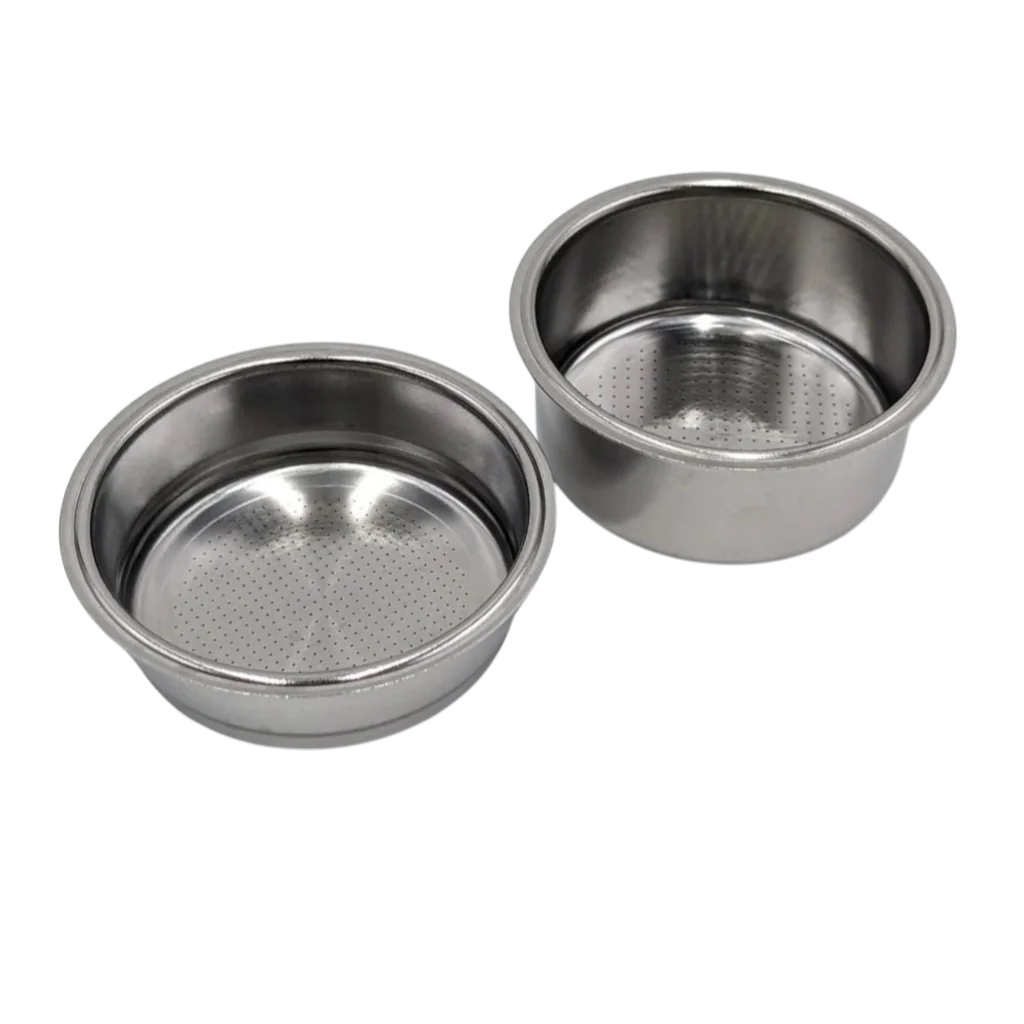
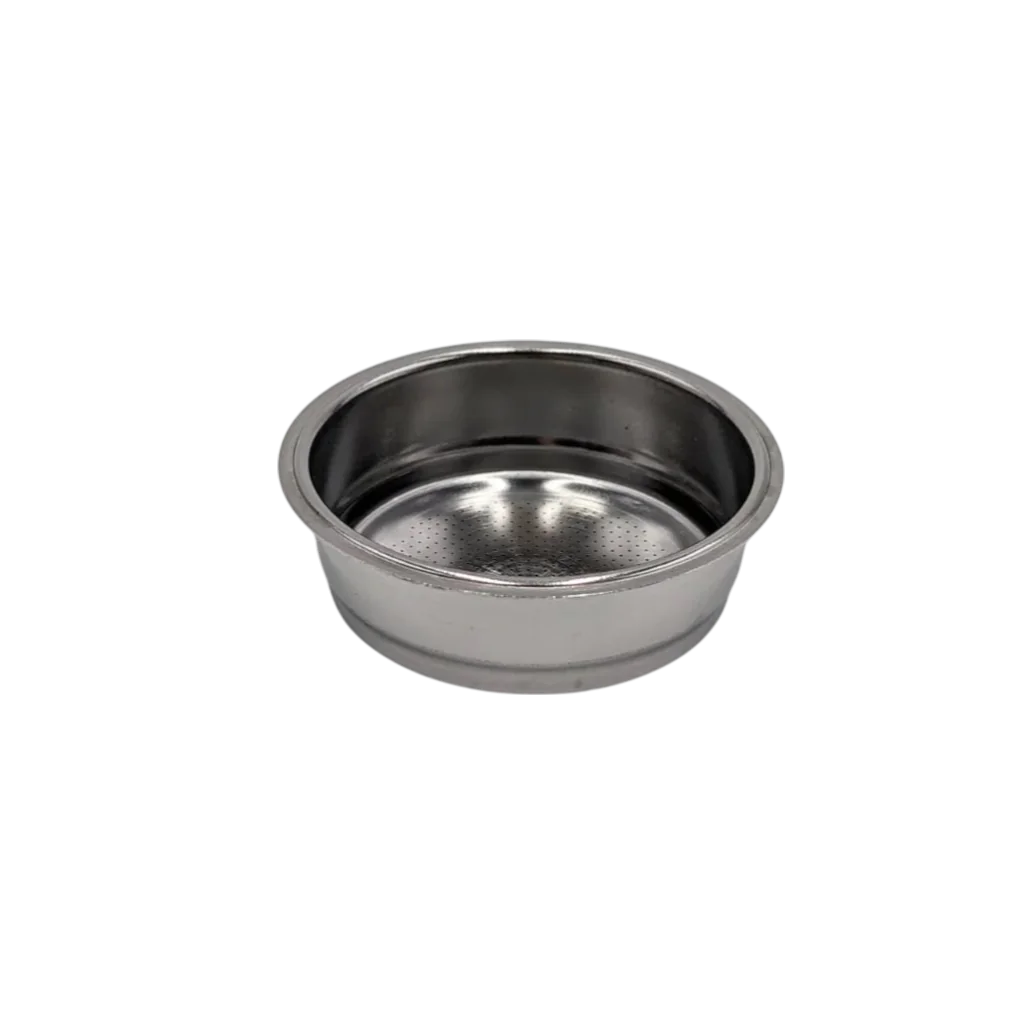
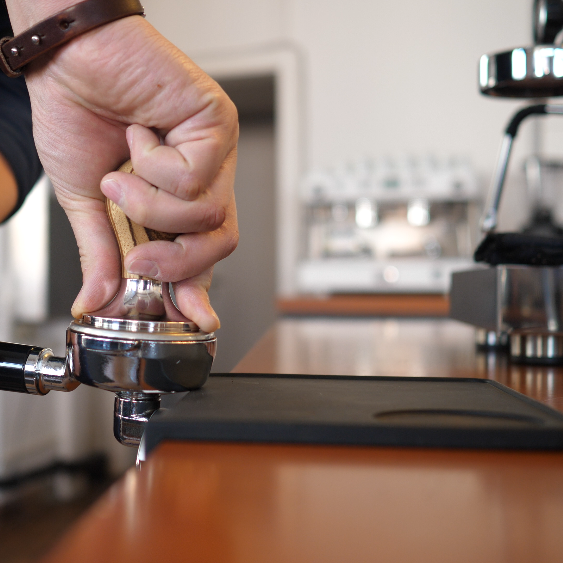
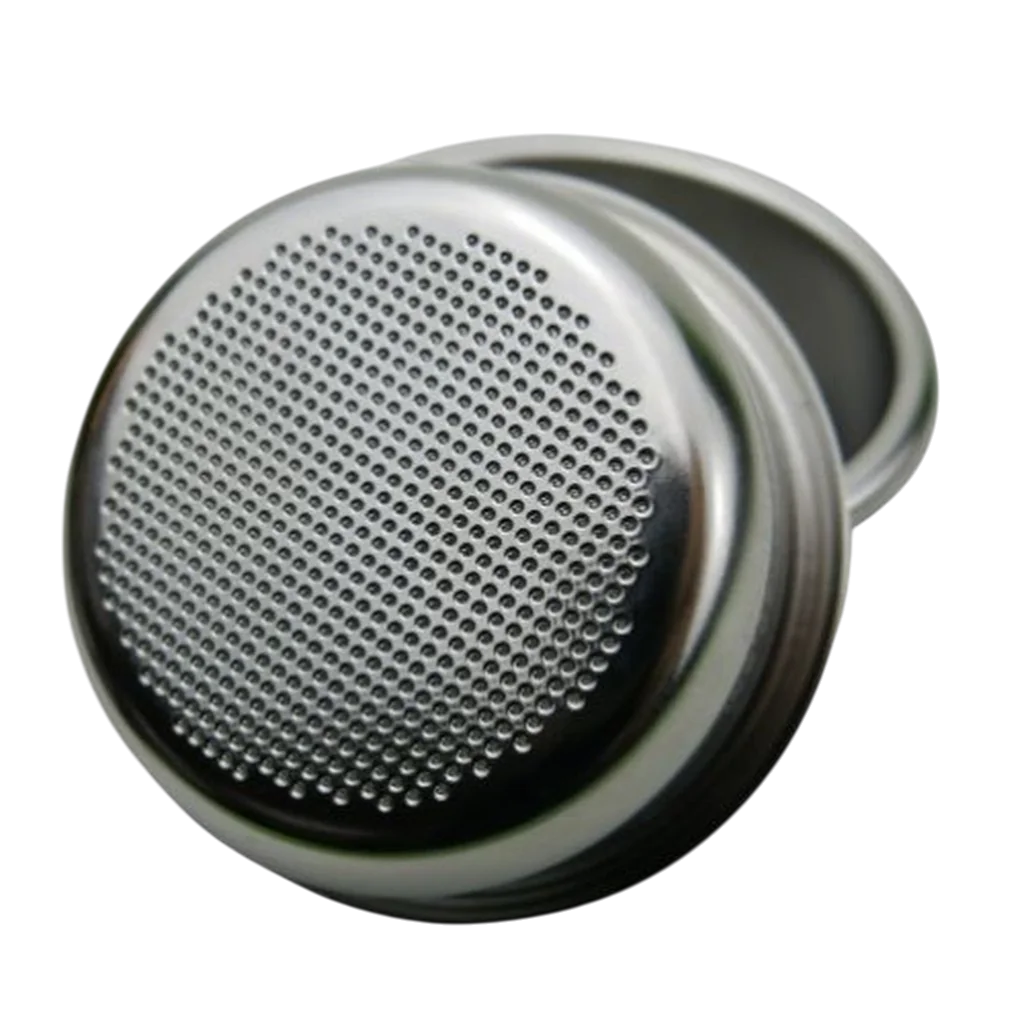
Tamping is the pressing of ground coffee powder in the portafilter. A tamper is used for "tamping," which consists of a handle and a metal base that is pressed like a piston into the portafilter. The metal base corresponds to the inner diameter of the basket. If the distance between the basket wall and tamper diameter is too large, some of the coffee powder will not be pressed sufficiently.
By pressing the ground coffee, uniform water distribution is enabled. The brewing water should encounter the same resistance from the ground coffee surface at all contact points. If the ground coffee is too loosely packed in places or if there are air pockets below the pressing point, there is a risk of channeling. This can be prevented through careful preparation of the ground coffee, vertical compression, and even tamping.
Instructions: Prepare espresso step by step (article and videos).

Three classic tampers with a 58mm diameter.
Research Question: What Influence Does Tamping Pressure Have?
Two aspects were examined. First, we wanted to find out whether changed tamping pressure affects the flow time. Second, we investigated whether the tamping pressure has an effect on the extraction yield and thus on the concentration of dissolved coffee particles in the cup.
To obtain the most precise result possible, work steps and methodology were precisely defined.
Material
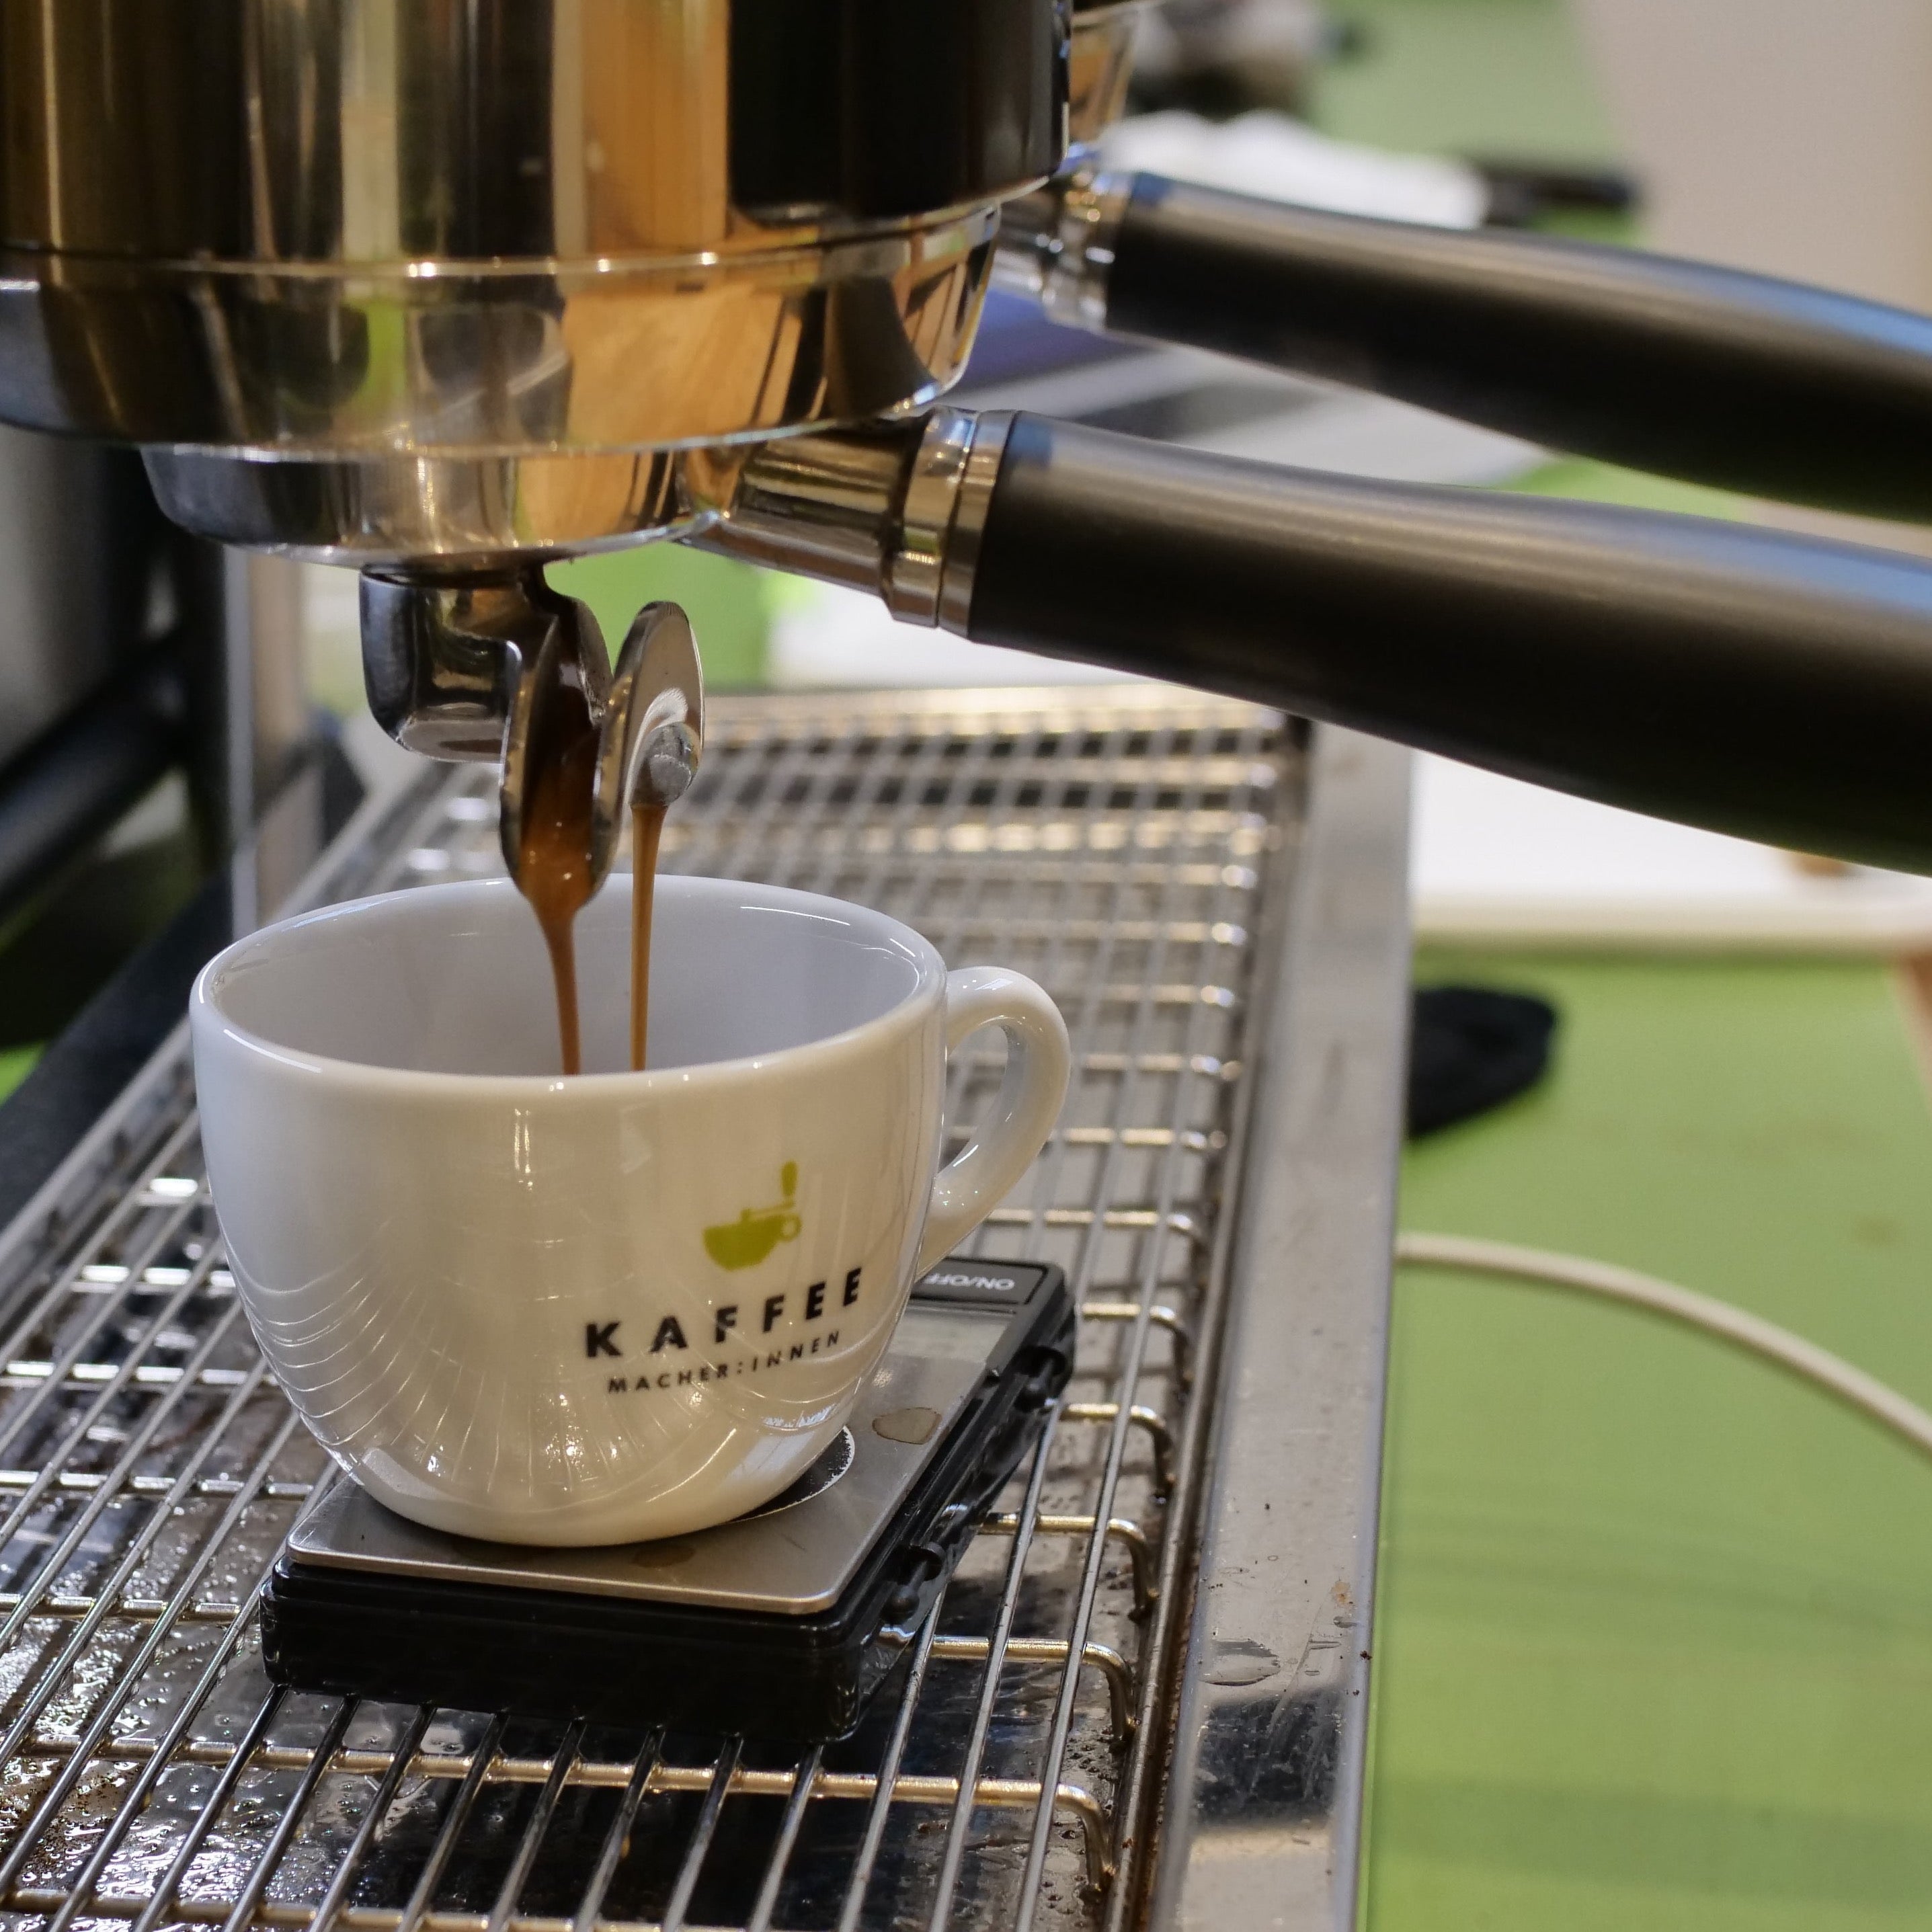
Rancilio Specialty, gastronomy espresso machine with precise flowmeter. However, each espresso shot was re-measured with the Acaia Luna.
Etzinger etzMax, espresso grinder with integrated scale. However, all grinds were re-weighed and repeated in case of deviation (see methodology).
Puqpress, automatic tamping machine for gastronomy use. Tamping pressure adjustable.
VST Refractometer, for measuring TDS in percent, i.e., the concentration of dissolved particles in the drink in relation to water.
VST syringe filter, to filter solids from the coffee solution and measure only the dissolved particles with the refractometer.
VST syringe

Etzmax espresso grinder and Puqpress
Methods
The espresso grinder is set to an output of 18.5 g. Grinding results between 18.4 g and 18.6 g are used.
The Rancilio Specialty espresso machine is programmed to an output water amount of 45 ml and a brew temperature of 93 °C.
The corresponding amount of coffee is ground directly into the portafilter. The coffee is then leveled by hand and tamped with the Puqpress. The portafilter is inserted into the machine and extraction is started.
The amount in the espresso cup is measured with a scale. After extraction, the portafilter is removed and knocked out.
A rinse shot is pulled on the espresso machine.
After extraction, the espressos are set aside to cool. After cooling, they are stirred and the TDS value is measured with the refractometer.
The espresso is injected into the refractometer via syringe using the syringe filter.
This process is repeated 50 times each for tamping pressures of 10 kg, 15 kg, and 20 kg.
Data analysis for flow time and TDS values was performed using a one-way ANOVA with a set error probability of 5%.
Results: Flow Time and Tamping Pressure
In the variance analysis of the flow time, no significant difference could be detected. In other words: regardless of whether 10 kg, 15 kg, or 20 kg of pressure was applied, in our measurements the results did not vary noticeably due to pressing pressure.

Effect of tamping pressure on extraction time.
| 10 kg Pressure | 15 kg Pressure | 20 kg Pressure |
| 26 | 20 | 27 |
| 21 | 23 | 25 |
| 23 | 26 | 29 |
| 24 | 27 | 28 |
| 23 | 25 | 24 |
| 24 | 26 | 27 |
| 25 | 26 | 23 |
| 24 | 29 | 25 |
| 26 | 20 | 26 |
| 31 | 24 | 27 |
| 25 | 23 | 25 |
| 24 | 23 | 21 |
| 25 | 22 | 26 |
| 27 | 23 | 21 |
| 24 | 30 | 24 |
| 24 | 24 | 21 |
| 25 | 22 | 24 |
| 27 | 21 | 25 |
| 23 | 21 | 28 |
| 31 | 24 | 22 |
| 25 | 24 | 22 |
| 24 | 25 | 24 |
| 22 | 30 | 23 |
| 27 | 20 | 25 |
| 22 | 21 | 22 |
| 25 | 23 | 25 |
| 25 | 21 | 21 |
| 24 | 21 | 22 |
| 24 | 27 | 21 |
| 23 | 22 | 24 |
| 27 | 23 | 22 |
| 21 | 22 | 30 |
| 24 | 24 | 21 |
| 25 | 21 | 25 |
| 24 | 25 | 29 |
| 25 | 24 | 26 |
| 23 | 24 | 23 |
| 23 | 23 | 24 |
| 23 | 23 | 24 |
| 22 | 23 | 23 |
| 21 | 22 | 24 |
| 26 | 24 | 26 |
| 23 | 25 | 24 |
| 25 | 22 | 20 |
| 24 | 23 | 27 |
| 20 | 23 | 22 |
| 24 | 26 | 25 |
| 24 | 22 | 26 |
| 22 | 21 | 22 |
| 23 | 24 | 20 |
| Groups | Count | Sum | Average | Variance |
| Column 1 | 50 | 1212 | 24.24 | 4.51265306 |
| Column 2 | 50 | 1177 | 23.54 | 5.60040816 |
| Column 3 | 50 | 1210 | 24.2 | 6.08163265 |
| Source of Variation | SS | df | MS | F | P-value | F crit |
| Between Groups | 15.4533333 | 2 | 7.72666667 | 1.43133301 | 0.242301 | 3.05762065 |
| Within Groups | 793.54 | 147 | 5.39823129 | |||
| Total | 808.993333 | 149 |
| Fk(0.05) | 3.05762065 |
The test statistic F is smaller than the critical F value, so no significant result is present. The actual P value exceeds the set error probability of 5%. Thus, no significant difference can be determined between the groups.
Results: TDS Values and Tamping Pressure
In the variance analysis of the TDS values, no significant difference could be determined either. The concentration of dissolved coffee particles was not substantially affected by different tamping pressure.

Effect of tamping pressure on concentration of dissolved particles.
| 10 kg Pressing | 15 kg Pressing | 20 kg Pressing |
| 8.53 | 7.77 | 8.15 |
| 7.99 | 7.94 | 8.15 |
| 8.03 | 8.02 | 8.16 |
| 8.13 | 8.03 | 8.27 |
| 8.01 | 8.08 | 8.2 |
| 8.01 | 8.06 | 8.08 |
| 8.1 | 8.07 | 8.08 |
| 8.05 | 8.26 | 8.01 |
| 8.2 | 8.12 | 7.96 |
| 8.24 | 7.96 | 8.03 |
| 8.17 | 7.98 | 7.99 |
| 8.15 | 7.99 | 8.03 |
| 7.91 | 7.85 | 8.11 |
| 8.09 | 8.02 | 8.02 |
| 8.09 | 8.88 | 8.02 |
| 8.09 | 8.12 | 8.01 |
| 8.11 | 8.11 | 7.93 |
| 8.15 | 7.99 | 8.04 |
| 7.96 | 7.99 | 8.04 |
| 8.3 | 8.05 | 7.99 |
| 8.25 | 8.15 | 7.99 |
| 7.99 | 8.2 | 8 |
| 8.07 | 8.28 | 7.99 |
| 7.99 | 7.81 | 8 |
| 7.81 | 7.84 | 7.97 |
| 7.8 | 7.92 | 8.01 |
| 7.93 | 7.9 | 8.01 |
| 7.94 | 7.87 | 7.66 |
| 7.86 | 7.97 | 7.8 |
| 7.93 | 7.88 | 7.89 |
| 8.06 | 8.02 | 7.99 |
| 8.08 | 8.02 | 8.02 |
| 7.99 | 7.95 | 7.92 |
| 8.04 | 7.7 | 7.99 |
| 8.05 | 7.89 | * |
| 8.13 | 8.01 | * |
| 8.2 | 8.11 | * |
| 8.19 | 7.95 | 7.91 |
| 7.98 | 8.02 | 7.96 |
| 7.94 | 8.07 | 7.7 |
| 7.82 | 7.94 | 8.01 |
| 8.08 | 8.04 | 8.08 |
| 8.08 | 8.05 | 7.92 |
| 8.07 | 7.96 | 7.83 |
| 8.06 | 7.97 | 8.03 |
| 7.88 | 7.78 | 7.97 |
| 7.88 | 8.01 | 7.97 |
| 7.93 | 7.81 | 7.91 |
| 7.97 | 7.73 | 7.65 |
| 7.96 | 7.85 | 7.69 |
TDS values. *these fields lack measured values
| Groups | Count | Sum | Average | Variance |
| Column 1 | 50 | 402.27 | 8.0454 | 0.01824167 |
| Column 2 | 50 | 399.99 | 7.9998 | 0.03163465 |
| Column 3 | 47 | 375.14 | 7.98170213 | 0.01635356 |
| Source of Variation | SS | df | MS | F | P-value | F crit |
| Between Groups | 0.10546284 | 2 | 0.05273142 | 2.37573217 | 0.0965805 | 3.058928 |
| Within Groups | 3.19620383 | 144 | 0.02219586 | |||
| Total | 3.30166667 | 146 |
| Fk 0.05 | 3.058928 |
| Fk 0.1 | 2.33979948 |
The test statistic F is smaller than the critical F value, so no significant result is present. The actual P value exceeds the set error probability of 5%. Thus, no significant difference can be determined between the groups.
Raw Data and Measurements from the Tamping Test
Raw data and further information can be found in the Excel sheet. If you are able to extract any additional interesting findings, we would love to hear about them.
Download Tamping Project Results
Analysis of the data revealed a linear correlation between the following data sets: extraction time and the measured TDS values, which was determined using the Bravais-Pearson correlation coefficient:
- Tamping pressure 10 kg: Extraction time and TDS: weak positive correlation -> r=0.5068
- Tamping pressure 15 kg: Extraction time and TDS: strong positive correlation -> r=0.6854
- Tamping pressure 20 kg: Extraction time and TDS: weak positive correlation -> r=0.5423
where: |r|= 1 -> perfect linear correlation
|r|= 0 -> no linear correlation
Pressing Pressure, Taste, and Additional Information
Within the scope of this test, the taste of the espresso was not examined. Therefore, no statement can be made about it. However, interpreting the findings of the test, we believe that varying pressing pressure within the range we examined has no or only marginal influence on taste.
We also cannot make any statement based on our test as to how pressure lower than 10 kilograms affects extraction. Based on studies, input from partners, and our own experience, we recommend tamping with at least 6 kilograms of pressing pressure.
Discussion
When investigating the question of whether tamping pressure affects the extraction time of espressos, no influence could be demonstrated. However, this does not mean that no influence exists, but only that no influence could be demonstrated in the test model used. Confounding variables include, for example, inaccuracies in preparation and insufficient precision of the examination machines used.
The equipment used was designed for professional use in gastronomy and not for precise laboratory equipment.
However, in practice there are far greater confounding factors in the preparation of an espresso than in the test procedure used.
Thus, in practice, one should not assume a large influence of tamping pressure on extraction, since there are a multitude of inconsistent parameters affecting the extraction process. Tamping pressure is only one parameter among many in this regard.
---
The tamping test was conducted by Michel Aeschbacher in collaboration with a food technologist who wishes to remain unnamed. Our thanks to you!
We are open to further research partnerships and are happy to use our material and expertise to develop findings on the topic of coffee.